Bookmark and Share
Showing posts with label Debug. Show all posts

Wednesday, July 10, 2013

TIP : Visual studio Remote debugging on different domains

Hello, you need to debug a remote server, from your workstation, you configure all the things following Microsoft’s specs.. but , you realize that is a hell to configure remote debugging on two machine with different domains.
Here is a trick :
  1. Create a new LOCAL user on the target server, with administrative privileges.
  2. Enable this user to remote connection
  3. Create a new LOCAL user on your workstation, with the same username and same password and with administrative privileges..
  4. Connect to the target server using remote desktop with the new user (this will create the user profile on the server)
  5. Launch the remote debugger on the target server
    image
  6. Go to options and copy the url of the remote debugger:
    image
  7. On your workstation open in visual studio the debug window
  8. Type in the address edit box the value  NEWUSERNAME@TARGETSERVERNAME (you just copied it)
  9. VoilĂ ! The remote debugger should connect successfully to the target server.
  10. If you have any problem try disabling the firewall on the two machines.
You can skip point 4 , you can execute the remote debugger using the “runas” command. If you connect using remote desktop you will have the profile of the user created on the target server, and I think that this helps.
Let me know if this helps you.
Happy remote debugging!

Monday, May 09, 2011

Sharp Snippet Compiler: there’s a new interactive .net compiler in town

If you need to test one C# instruction and you don’t want to wait 3 minutes for the Visual Studio 2010 startup, here is the solution, use Sharp Snippet Compiler, write the code, add breakpoints , hit F5 and see the results:

image

Here are the functions available:

  • variables watch window
  • stepping through the code
  • assembly references
  • light and fast
  • syntax highlighting
  • IntelliSense code-completion
  • supports .NET 3.5 features

This tool replaces the old “Snipper Compiler”, last updated in 2007 :

image

Wednesday, December 09, 2009

How to inspect Blue Screen Issues or the Blue Screen of Death (BSOD)

Hello, today I’ll show you how to address the terrible Blue Screen on windows systems, this problem i also known as “BSOD Blue Screen Of Death”

Here is a typical BSOD:

image

The most important info is the first error code (number 1) and, if present, the driver/dll who caused it.

The hexadecimal number following the word "STOP" is called the bug check code or Stop code.

If you read the “Device and Driver Development Tools – Bug Check Codes” you can find the error code and what it means, for example the STOP:50 is a :

Bug Check 0x50: PAGE_FAULT_IN_NONPAGED_AREA
The PAGE_FAULT_IN_NONPAGED_AREA bug check has a value of 0x00000050. This indicates that invalid system memory has been referenced.

The other parameters are specific for the error code, in this example the third parameter identifies a “Write Operation” on Memory.

Now we have two options, the Easy Way and the Hard Way, let’s start from the Easy Way.

Remember to enable the Crash Analysis option using the System Option from the Control Panel , see also this link

The Easy Way- if you need to run

Install this useful application WhoCrashed from Resplendence Software House.

Launch the application on the system where the BSOD appears, download,if asked, the Debugging Symbols from Microsoft and click the “Analyze” button, after some time the app will show you the info about the most suspect dll/driver, here is an example from the SW web site:

Upgrade/Disable/Uninstall it and… the BSOD will disappear.

The hard way – if you need to know the details

Install the “Debugging Tools for Windows”  debugger, configure the Symbols Path with the right string, for example:

SRV*c:\websymbols*http://msdl.microsoft.com/download/symbols

image

Use the “File—>Open Crash Dump” option and load the dump from “%SYSTEMROOT%\minidump”

image

At the first load you can see this message:
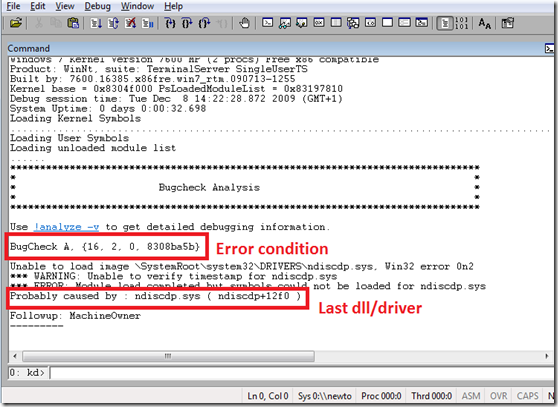
image

Execute the !analyze –v command, the debugger will analyze the call stack:

image

Click on the module name link and you will see the path and the details of the faulting module:

image

Identify the DLL vendor and update his application or uninstall/disable it if no updates are available, the BSOD should disappear from your system.

Hope it helps!

UPDATE #1

How to disable a BSOD driver from windows start

If the BSOD is caused by a driver you need to disable it from loading on windows boot.

Download from sysinternals site the AutoRuns program, execute it and open the Drivers Tab:
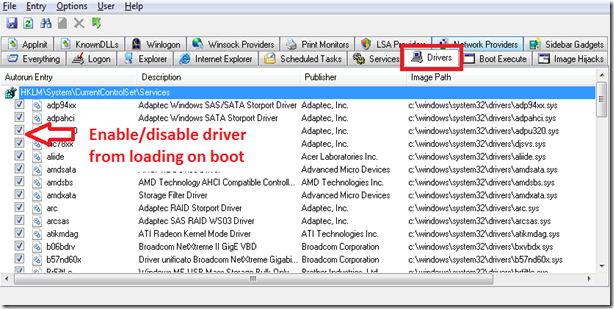
image

Friday, November 20, 2009

IE8 slow tabs opening, IE8 and ssvagent.exe investigation..

Today I’ve noticed that the opening of Internet Explorer 8 was too slow, 15-20 seconds… with the window blocked.

image

It’s a Microsoft fault?? Let’s investigate.

I Opened the Task Manager and I saw Cpu spikes for 20 seconds during the IE start:

image

With Sysinternals Process Explorer I’ve investigated the process detail, on every tabs opening there was a process that started and used the CPU for 15 seconds.. the process was a Sun Microsystems program, not Ms.

image

I Investigated the thread detail of the process and I found that the CPU activity was on a single thread:

image

The detail of the thread shown that the CPU problem was correlated with functions used by the Mozilla Plugins system:

image

Plugins? Let’s see the Plugin section in Internet Explorer, I found Java Plugin , and it was enabled and loaded:

image

Let’s try to deactivate it, close and open the browser and…image

Wow, now the start time is only 3 seconds, and this time is the same for the tabs opening. 

image

Hope it helps!

UPDATE #1 - 2009-11-23

As feranm wrote I should have checked the loading time of the plugin using the “load time” column in the plugin list.

But for this plugin the loading time wasn’t available:image

UPDATE #2 - 2009-11-23

In my office 4 users over 4 decided to use Firefox, they felt “Internet Explorer 8 is very slow…”
After the fix they were happy and started to use IE8 again.

Is Microsoft aware of this problem? Does Microsoft know that their product is felt by the users as “slow and unresponsive on startup”, and this bad feeling is caused by Sun Microsystems?

Wednesday, November 18, 2009

Cannot open the outlook window…

This morning I tried to open the Outlook client and.. here is the error:

image

and the italian message:

image

Looking at the windows events log (eventvwr on command line) I saw these messages:

“Outlook: The store was last opened on a different machine.”

Searching with Google I found this little trick, Outlook has a “reset” command switch that clears the outlook state:

Open command line, go to your Outlook folder and type:

outlook.exe  /resetnavpane

And the Outlook start will be fixed!


outlook.exe /resetnavpane

Friday, November 13, 2009

How to configure Sysinternals Procmon & Procexplorer debug sysmbols

If you use Process Explorer or Process Monitor from sysinternals you will find useful to see the names of the called function in the call stack window.

Go to Options—>Configure Symbols and type:
image

Here are the strings:
C:\Program Files\Debugging Tools for Windows (x86)\dbghelp.dll
and
SRV*c:\websymbols*http://msdl.microsoft.com/download/symbols

Here is an example of complete call stack, note the windows function names:

image

Remember to install the latest Debugging Tools For Windows!