Bookmark and Share
Showing posts with label Performance. Show all posts

Thursday, March 29, 2018

Wordpress php performance analysis

If you need to check the performance of your Wordpress installation (or any PHP application) you can use the awesome XDEBUG Extension for PHP.

Steps to follow:

  • On the web server open a command/shell and execute
    php -i > c:\phpinfo.txt
  • Copy the output fron the phpinfo.txt
  • Connect to https://xdebug.org/wizard.php
  • Copy the phpinfo and analyze it using the wizard:
    image
  • Click “Analyze”, they will give you installation instructions:
    image

Here are the steps I followed on windows:

  • On windows download the http://xdebug.org/files/php_xdebug-2.6.0-7.1-vc14-nts-x86_64.dll  dll
  • Copy it in your PHP extension PATH , example : C:\Program Files\PHP\v7.1\ext
  • Edit the php.ini file, i.e : C:\Program Files\PHP\v7.1\php.ini
  • Add on the top these commands:
    xdebug.profiler_enable = 1
    xdebug.profiler_enable_trigger = 0
    xdebug.profiler_output_dir = "C:/Temp/"
  • Be sure the C:\Temp folder exists, the logs will be copied here
  • Add also this line :
    zend_extension = "c:\Program Files\PHP\v7.1\ext\php_xdebug-2.6.0-7.1-vc14-nts-x86_64.dll"

After you followed the installation instructions here is the analysis part:

  • Install this tool : https://sourceforge.net/projects/qcachegrindwin/, it’s the log viewer
  • Reload your page, the c:\Temp folder should start to be populated with “cachegrind.out” files
  • Note that the page will be slower…. so don’t forget to comment all commands after your analysis finishes.
  • Open QCacheGrind
  • Open the log file
  • Activate the Callee Map on the right:
    image
  • It seems I have a problem related to the “sqli_real_connect”….
  • Investigate and fix the problem (in my case I used the db name localhost instead of 127.0.0.1  https://stackoverflow.com/questions/13439817/why-is-my-mysqli-connection-so-slow)
  • Analyze again….
    image
  • Well, the sqli_real_connect problem seems fixed.

Hope it helps!

    Friday, November 20, 2009

    IE8 slow tabs opening, IE8 and ssvagent.exe investigation..

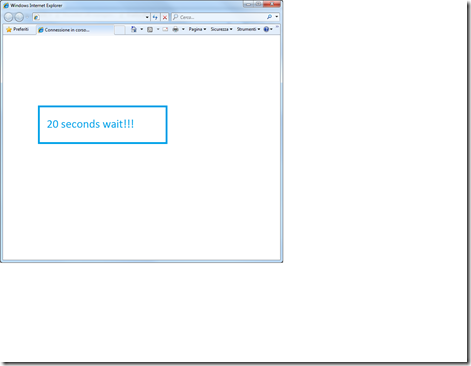
    Today I’ve noticed that the opening of Internet Explorer 8 was too slow, 15-20 seconds… with the window blocked.

    image

    It’s a Microsoft fault?? Let’s investigate.

    I Opened the Task Manager and I saw Cpu spikes for 20 seconds during the IE start:

    image

    With Sysinternals Process Explorer I’ve investigated the process detail, on every tabs opening there was a process that started and used the CPU for 15 seconds.. the process was a Sun Microsystems program, not Ms.

    image

    I Investigated the thread detail of the process and I found that the CPU activity was on a single thread:

    image

    The detail of the thread shown that the CPU problem was correlated with functions used by the Mozilla Plugins system:

    image

    Plugins? Let’s see the Plugin section in Internet Explorer, I found Java Plugin , and it was enabled and loaded:

    image

    Let’s try to deactivate it, close and open the browser and…image

    Wow, now the start time is only 3 seconds, and this time is the same for the tabs opening. 

    image

    Hope it helps!

    UPDATE #1 - 2009-11-23

    As feranm wrote I should have checked the loading time of the plugin using the “load time” column in the plugin list.

    But for this plugin the loading time wasn’t available:image

    UPDATE #2 - 2009-11-23

    In my office 4 users over 4 decided to use Firefox, they felt “Internet Explorer 8 is very slow…”
    After the fix they were happy and started to use IE8 again.

    Is Microsoft aware of this problem? Does Microsoft know that their product is felt by the users as “slow and unresponsive on startup”, and this bad feeling is caused by Sun Microsystems?